While I was testing out Homegroup using a newly installed Dimension 8300, I got my first BSOD (Blue Screen of Death) of Windows 7 Beta. Unfortunately, the system rebooted automatically by default, I was not able to take a screenshot. There is one thing strange about the memory dump. The advance system settings shows that the memory dump file is saved as C:\Windows\MEMORY.DMP by default. However, I couldn’t find the dump file. Instead, I found the file is created under C:\Windows\Minidump. Maybe it’s just a bug, but anyway, if you cannot find the file under Windows, try the Minidump subfolder.
I was wondering if the old way of analyzing memory dump still works, so I tried it and it did work. Here are the steps.
- Download and install the Debugging Tools for Windows from this link. My installation is a 32bit one, so I downloaded the 32 bit version 6.10.3.233.
- Download and extract the debugging wizard (debugwiz.exe) from Windows BBS. There is a note on the site saying this tool does not work properly with Vista 64 bit. My guess is it probably does not work with Windows 7, either.
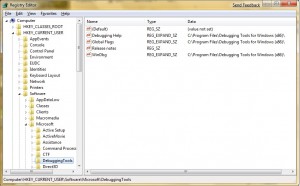
- The debug wizard relies on a registry key HKCU\Software\Microsoft\DebuggingTools to find the binary files for the debugging tools. This key is not generated by the debugging tools installer any more. You have to enter the key manually using regedit.exe .

Otherwise, you can just merge this registry file. - Right click on the debugwiz.exe extracted in step 2 and select Run as administrator.
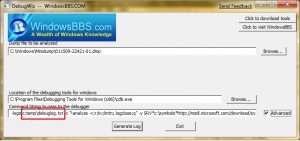
- Click on the Browse button and pick the memory dump file.
- There is one more step before you try to generate the analysis log. The Command String is not correct. Check the Advanced checkbox and change the string from c:tempdebuglog.txt to c:debuglog.txt .

- Click on Generate log and the analysis log will be generated and saved in c:debuglog.txt .
Ok, you now have a analysis log, but it’s filled with jargons. What can you do? I usually only look for the line that starts with “Probably caused by”. In this case, the acutal line is
Probably caused by : memory_corruption ( nt!MiFindNodeOrParent+5 )
I know then the cause is probably due to bad memory module. On most cases, it’s usually a system file or a driver. You have to find the proper update for the offending file or uninstall the software which uses that file to fix your system.
This post may contain affiliated links. When you click on the link and purchase a product, we receive a small commision to keep us running. Thanks.

Leave a Reply